|
View Latest Data |

|
Log-in Register |
||||||||||
| Title: | Fleet Numbering Chronology - Updated |
| Summary: | Updated charts plotting central fleet numbers against delivery dates, with some background text. |
| Category: | Statistics |
| Author: | Thomas Young |
| Posted: | 15/10/2022 |
| Last updated: | 15/10/2022 |
| Download: | article035.pdf |
| Content: |
Introduction
An article added to this website way back in 2006 looked at how the allocation of fleetnumbers could give indicators of the size and renewal rate of the central fleet of service vehicles (those supplied by LT/LUL for use by London-wide organisations such as LT, LUL, LBSL and TfL). I was reminded of this recently when I was considering how the COVID-19 pandemic had affected the fleet. It seemed a good time to provide a follow-on article with some updated graphs. About the charts
There are two charts in this article, both of which plot the fleetnumber of each vehicle against the date when it was taken into stock. Bear in mind that there are several factors that may skew or distort the figures used for the charts. For instance, some vehicles were not given fleetnumbers (though this seems to be much reduced over the past 10 years or so), while dates into stock are based on a combination of observations and licensing data so may not be completely accurate. Even so, the charts do give an interesting overview of changes in the central fleet.
The first chart plots all known fleetnumbers for leased vehicles from 1982 to the present. It was in 1982 that a new number series was started for leased vehicles, this using numbers in the range 3000 upwards. The original number series (which had started at 1 in 1939 and had reached up to the 2300s) was retained only for owned vehicles, of which there were far fewer. The fact that fleetnumbers have continued to be allocated and (in most cases) physically displayed on the vehicles is probably the main reason why there is still an interest in the fleet among enthusiasts. For spotters, it makes it easier to keep a track of which vehicles you have seen (and which you haven‟t), while for others it gives a sense of historical continuity and enables changes such as the fleet size and renewal rate to be determined.
The second chart looks in more detail at the past ten years, only showing fleetnumbers from 7000 upwards.
Both charts have trendlines added, making changes in the intake rate more apparent.
The charts in detail
Looking at the first chart, it can be seen that fleet intake was relatively constant from 1982 until about 2000. The total fleet at any given time in this period was about 500 vehicles. It had risen to over 600 by 1994 but then dropped a bit when the bus operating units were privatised, taking with them a portion of the fleet. From 2000 until 2008, the rate of fleet intake gradually increased. Coupled with changes in the disposal rate, this period saw the central fleet almost double in size to around 1,000. Reasons for this include an increase in maintenance and renewal of the underground network, the division of infrastructure work between three new PPP consortia (under the Metronet and Tube Lines brands) and changes in working practices such as a reduction in the use of engineering trains.
Between 2008 and 2020, the plot line on the graph takes on a distinctly 'wavy' form. It would appear that the cycle of renewal became a little bit unsynchronised during this period, with a pattern of high intake one year followed by relatively low intake the next. The vehicles added in the 'high' year would then become due for replacement three or four years later, resulting in another high year. The fleet size seems to have peaked in 2008 and then stayed constant at about 1,000.
On the second chart there are two noticeable features. Firstly the plots are rather more scattered than hitherto, with several noticeable outliers. Some of these resulted from vehicles whose delivery was delayed for various reasons, while it may also be that some fleetnumbers were allocated, cancelled and then reused later on. As already mentioned, there is also the factor that some of our data is based on observations and licensing records, rather than actual company information.
The second feature is the drop-off since early 2020. The worldwide COVID-19 pandemic reached the UK at this time, with the first of several 'lock-down' periods starting in March 2020. This affected almost every aspect of business and personal life. Various vehicles were in the process of delivery at the time (most notably a large batch of Volkswagen Crafter vans for London Buses) and the lock-downs resulted in these vehicles being left at the dealerships for several months. Maintenance work on the underground would have been reduced to essential items only, while, conversely, social distancing measures meant that more vehicles might be needed to take a given number of staff to a work site.
Deliveries of some service vehicles resumed from mid-2020 onwards, but there was then a marked down-turn in the rate of intake. TfL's revenues had taken a hammering during the lock-downs, with far fewer people travelling. Government bail-outs were required, and any means by which money could be saved were looked at. It would appear that this included the renewal of the service vehicle fleet and the normal intake of about 200 vehicles per year was slashed. Although we don't necessarily have the complete picture, it seems that only about a dozen vehicle were added in 2021. And even though the worst of the COVID-19 impacts have now passed, the service vehicle slow-down has continued into 2022, with barely any additions at all. Only 8 central fleet vehicles with 21/71 registrations have been reported, and one of those was a demonstrator. As of October 2022, no 22/72 registered central fleet vehicles have been reported at all.
Rather obviously, this has had an impact on the progress of fleetnumbers. By extending the trendline on the second chart forwards it can be seen that fleetnumbers would have reached about the 9500 mark by now, had the rate of renewal seen over the past decade continued. Instead the highest number in use is still 9165VW, which actually arrived 2 years ago.
An interesting prospect is what will happen when fleetnumbers reach 9999. Will they continue into the 10,000s? Will they start a new series or re-use an old one? Or will fleetnumbers be dropped as being nonessential? Only time will tell, but the other unknown is when this milestone will be reached. If COVID-19 had not happened, data suggested that fleetnumber 9999 would have been allocated sometime in the second half of 2024. In reality, it is now almost impossible to predict when it will happen.
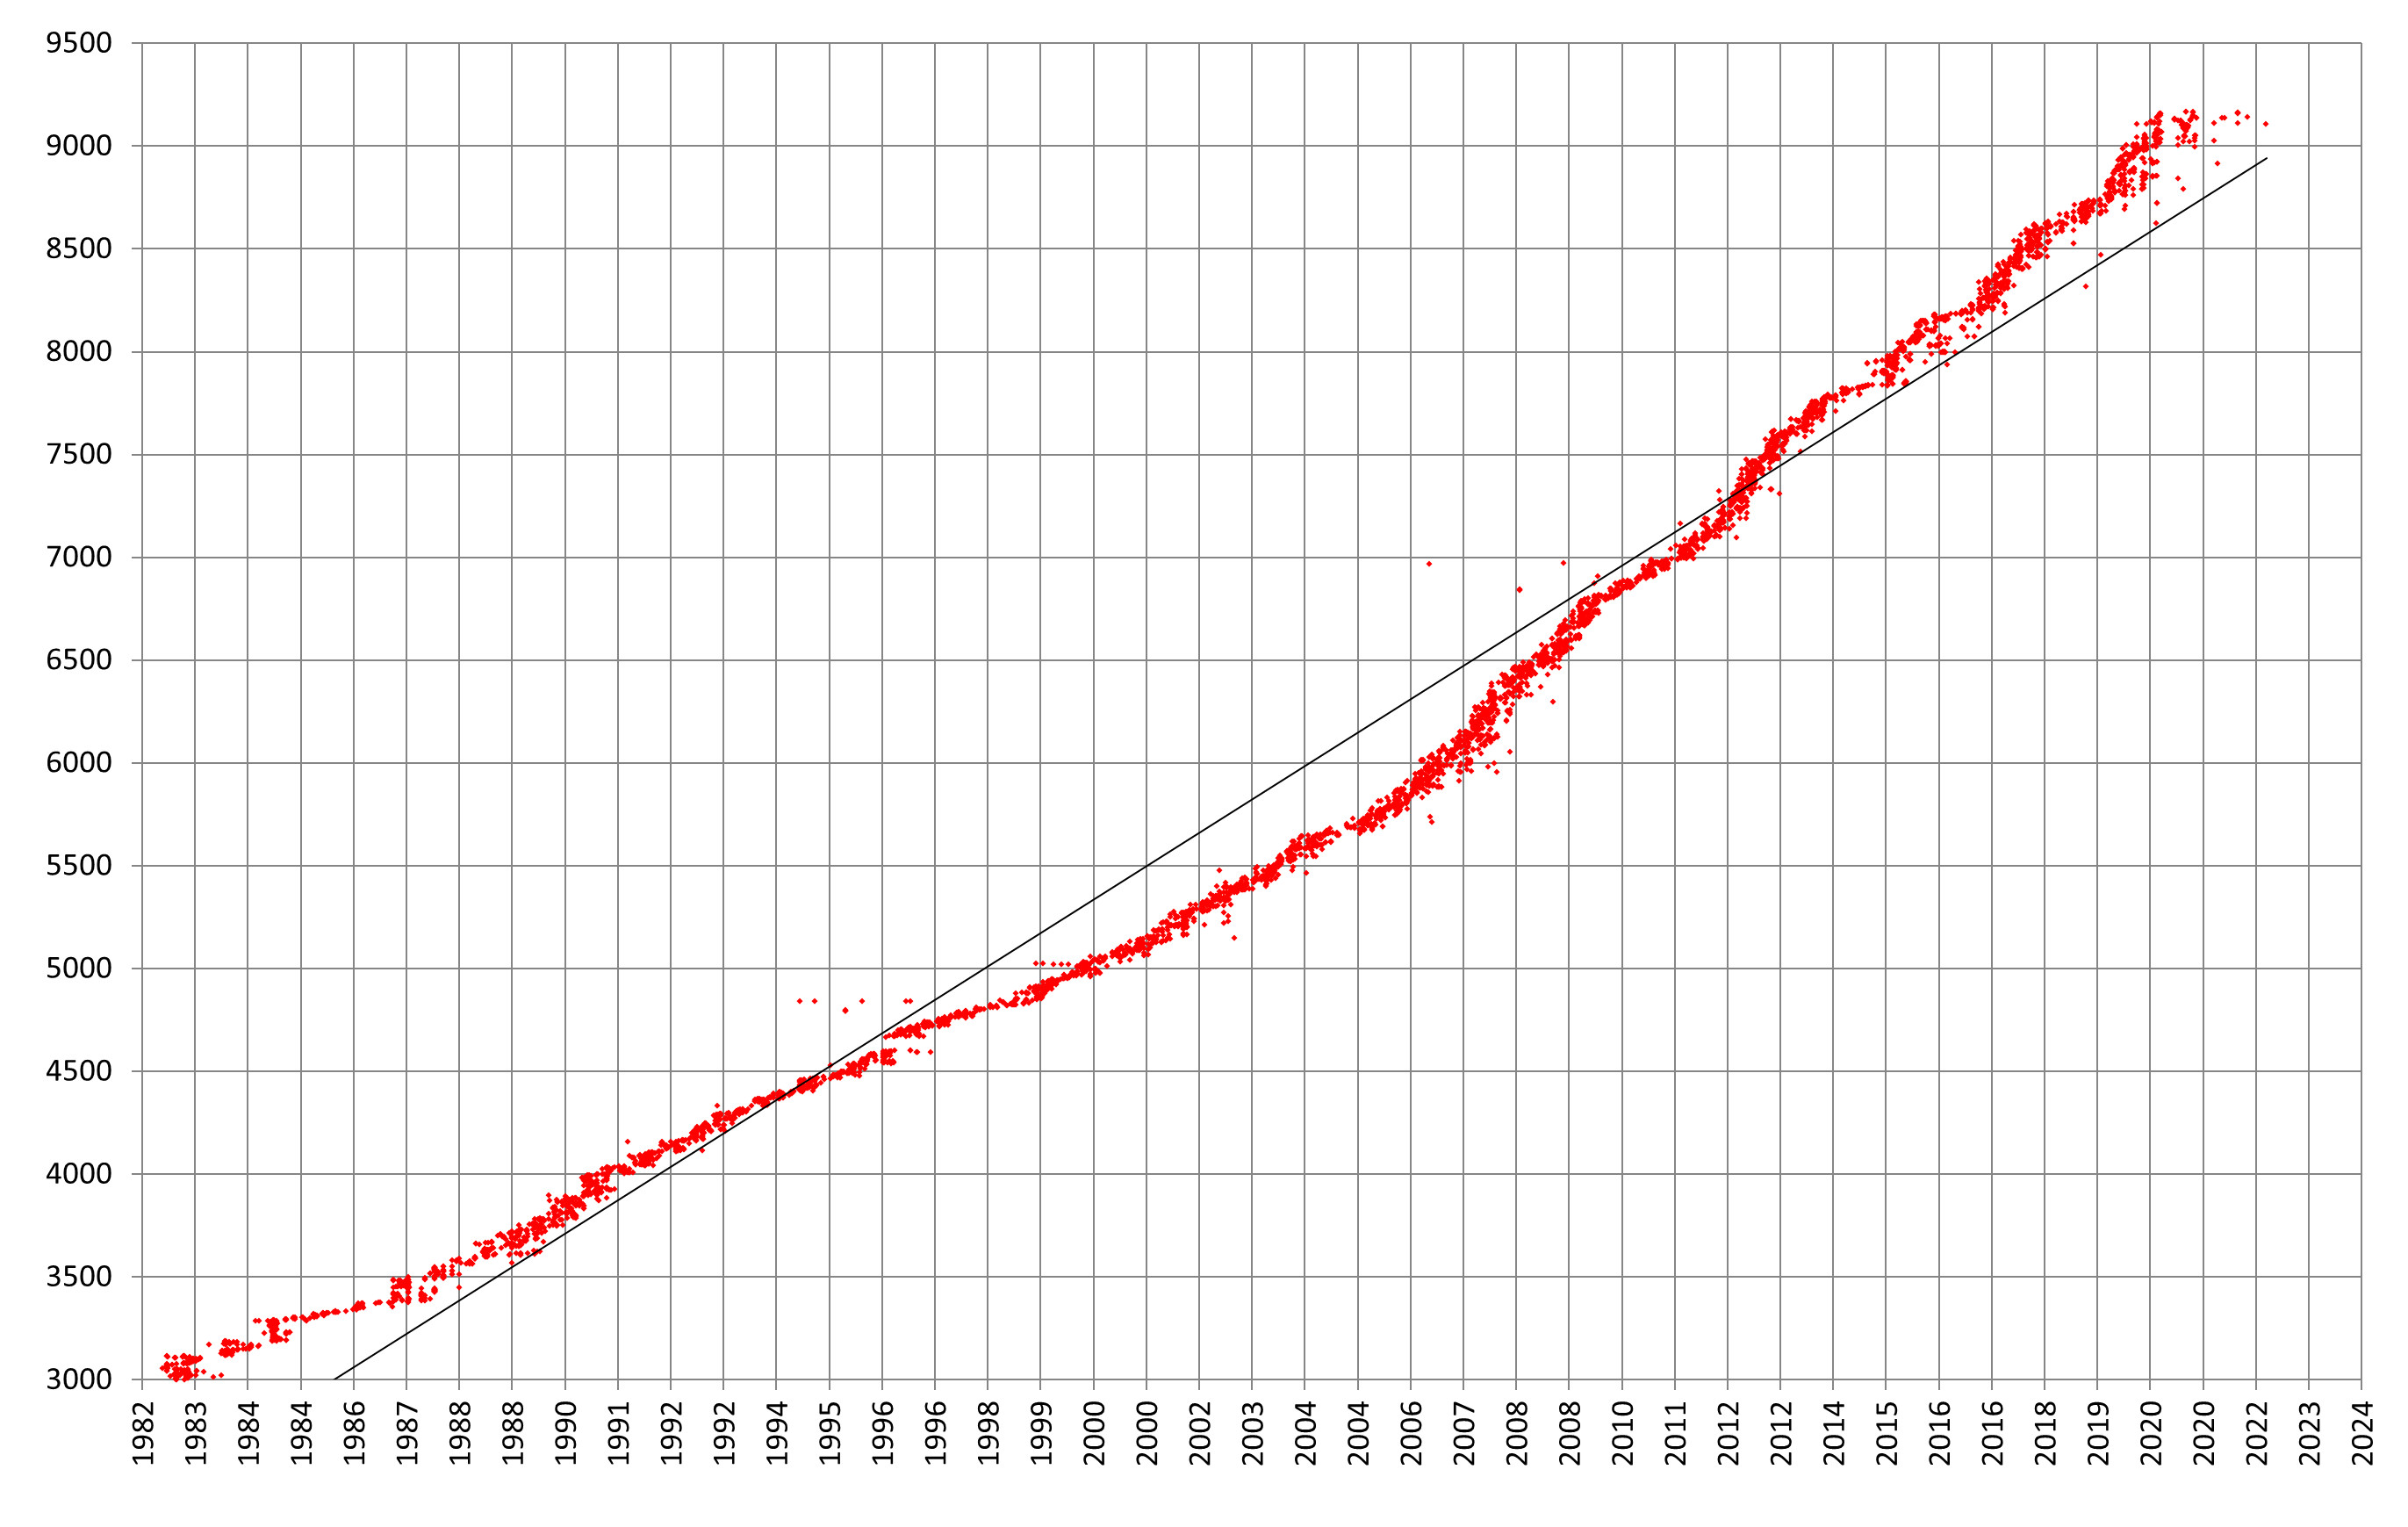 Fig.1 – Overall chart for fleetnumbers 3000 upwards 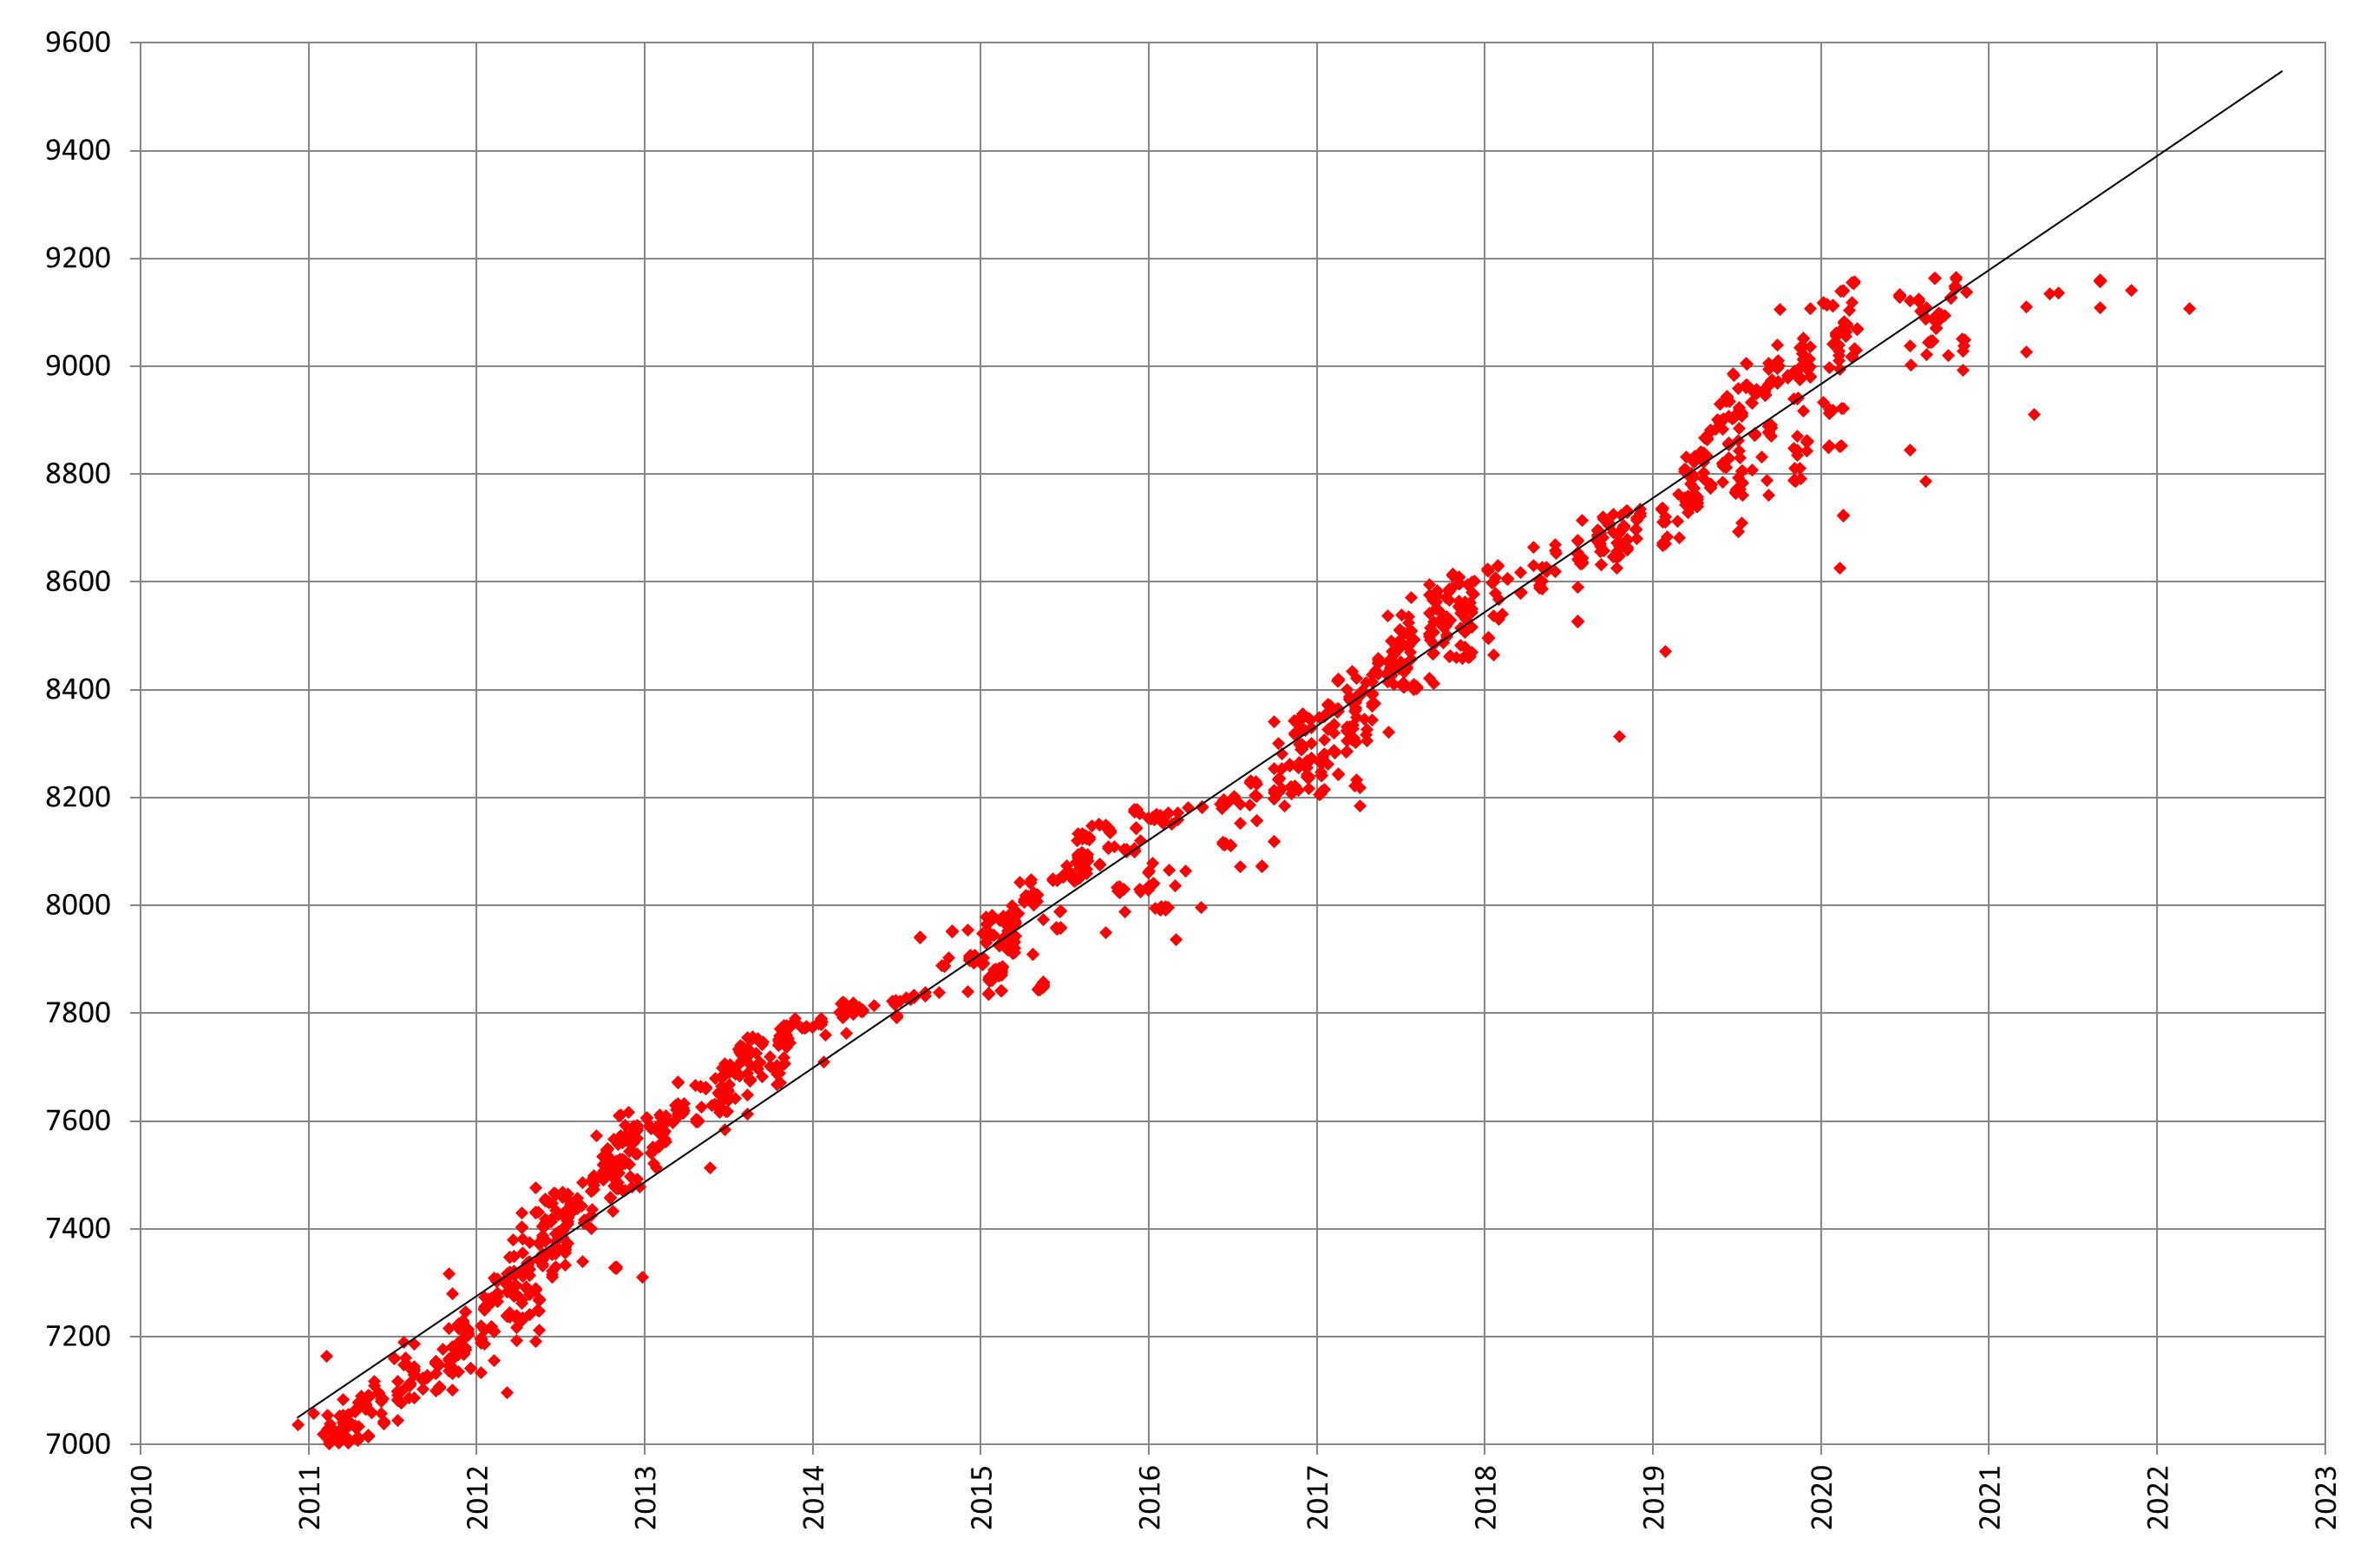 Fig.2 – Detail chart for fleetnumbers 7000 upwards This article is also available as a downloadable PDF. To view the file, left-click the link below. To download the file, right-click the link and select 'Save link as...'. article035.pdf |